We have had a long period of economic growth since the great recession of 2009, leading many market commentators to fear a recession is overdue. One fairly reliable indicator of coming recession is an inverted yield curve – meaning that short term interest rates are above long term rates. This looks increasingly possible but is not yet certain.
*
The US economy has been growing since the third quarter of 2009, following a very deep recession in 2008-09 caused by the global financial crisis. The stock market has been trending upwards for even longer. This combination of long running good news has made a lot of people fear that things must soon go wrong. One piece of evidence they cite is that we may be approaching an inverted yield curve.
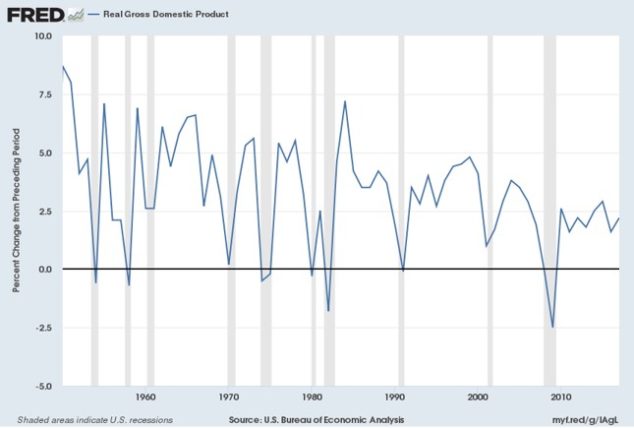
There is no economic rule that says economic expansions must have a shelf life. As the chart below shows (recessions are shown in grey), the current expansion is longer than the previous one but not exceptional compared with the two before that. Recessions happen from time to time, which encourages talk of a business cycle, but that is rather loose talk. There is no fixed period cycle in the sense of a sine wave and it is possible for random fluctuations to look as if there is a deeper pattern, especially to human eyes that have evolved to see patterns where they may not exist.
Recessions usually happen for one of two reasons. First, there can be an external shock such as the two sharp rises in oil prices in 1973 and 1979, caused by the Yom Kippur war in the Middle East in the first case, and the Iranian Revolution in the second. The US economy was a lot more energy-intensive then and a rise in oil prices was both inflationary (it put up prices across the economy) and deflationary (it cut consumers’ spending power, making the US as a whole worse off than before).
The second type of recession comes from the Federal Reserve raising rates to halt rising inflation resulting from an overheating economy, as economic demand threatens to exceed the national economic supply. One Fed Chairman once famously described their role as “to take away the punch bowl just as the party gets going,” (A punch bowl is a large metal dish for holding alcoholic drink, still occasionally seen in Cambridge colleges). If the Fed misjudges its timing, it may find it has left the punch bowl out for too long and so needs to administer a shock in the form of much higher interest rates. It is this type of recession that currently worries people, as the Fed is certainly raising interest rates and the economy appears to be reaching full employment on traditional measures (though there are grounds for believing it still has spare capacity).
One old rule of thumb for predicting an imminent recession is the inverted yield curve, meaning that short term interest rates are above long term. The yield curve is a plot of interest rates on government securities at different maturities. It is also known as the term structure of interest rates. The Fed targets the short term Fed Funds rate, the overnight rate of interest on the New York inter-bank lending market. It usually doesn’t target the long term rate (usually defined as the rate of interest on 10 year Treasury bonds) though it did during the period of quantitative easing. Why is this relationship important and potentially informative?
The short term rate is the benchmark rate for all lending in the economy and is under the Fed’s control. The long term rate is determined by the overall demand and supply of capital, including the rest of the world (foreign demand and supply) since US government bonds trade in a global market and have unique appeal for foreign investors seeking a liquid, deep market for very low risk assets.
Economic theory tells us that the long term rate should be equivalent to the sequence of expected short term rates, projected forward. In practice the long term rate is usually a bit higher than this, reflecting a term premium which can vary over time but is usually thought to be a compensation for the higher risk of inflation that investors bear when they own long term debt. But it also reflects global appetite for risk, something that may have fallen in recent years, leading to a stronger than usual demand for US government bonds, the world’s key “safe asset”. Changes in the term premium complicate any interpretation of the relationship between short and long run interest rates.
Owing to the term premium, the normal relationship between short and long rates is that long rates are higher. So the yield curve is usually upward sloping, and the absolute gap between long rates and short rates is positive.
Since long term rates are set by the market, they tell us something about investor expectations of the future. Chief among those expectations is what investor expect for future inflation. If you think inflation will be higher then you need a higher rate of nominal interest on an investment to justify holding it. Low long term rates by contrast suggest investors believe future inflation will be low, possibly because they don’t expect high economic growth.
Rising short term rates normally happen when the Fed believes current or expected inflation is too high relative to its 2% target. Raising short term rates is the main way that the Fed tries to steer the economy back to low inflation growth, but it can sometimes overdo it and cause a recession. A recession will normally bring inflation down, but it’s not consistent with the Fed’s second goal, of maximising employment. Nonetheless, the US economy is a complex system and it is difficult for the Fed to know precisely how to set interest rates. The market knows that the Fed sometimes causes a recession and anticipates that future inflation will fall, possibly undershooting the Fed’s target (as it did for much of the time following the financial crisis).
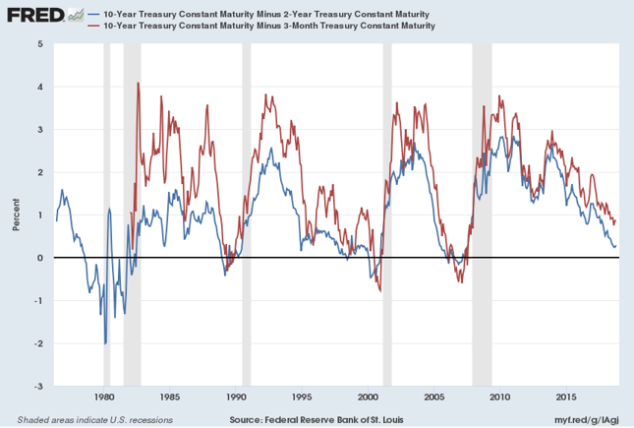
The simple difference between the short and long term rate is known as the yield curve. Markets usually use the 2 year rate as their measure of the short term rate, since it incorporates expectations of Fed interest rate changes into the next couple of years. Another measure is the 3-month Treasury Bill, which is much closer to the Fed Funds rate. The chart below shows the absolute gap between the long rate and the two different measure of short rates.
Note that there does seem to be a fairly reliable relation between a negative 10 year/2 year yield gap or term spread, and subsequent recessions. We don’t have that many observations but research done by the Federal Reserve Board of San Francisco confirms the predictive power of a negative term spread. Using the 3-month yield gives a very similar story.
What worries a lot of people is that the chart shows that the recent spread has been steadily narrowing, suggesting that it could reach zero or go negative in the next year or less. As the Macro-musings blog points out, some recent speeches by Fed board members suggest they think that even if the yield curve does invert it doesn’t mean that there will be a recession, which might be seen as a version of “this time is different” (for example President of the New York Fed, John Williams). Why would they think this? It’s partly because although quantitative easing is no longer active, the Fed is still buying government bonds to replace the ones that mature from its earlier market purchases. It’s possible that long term rates remain artificially a bit low because of this, though it’s very hard to measure how much.
Those same Fed speeches give some clues as to current Fed targets for short term rates. One in particular by Governor Lael Brainard in September argued that the Fed’s econometric model suggested the long term neutral rate consistent with stable inflation at 2% and full employment was about 2.5-3.5%. That would imply the current rising rates cycle might peak at about 3%. But Governor Brainard suggested that in the current economic circumstances (an economy with very low unemployment and where growth is potentially above its long term trend, partly owing to last year’s tax cuts) short term rates might go above the long term neutral rate. So market expectations are for rates to reach 3.5% and possibly more if the economic data remain very strong. If the average growth rate of wages picks up further then so will expectations of additional short term interest rate increases above what is already priced in.
With the US long term bond rate currently about 3.2% it wouldn’t take much for the yield spread to become negative – the yield curve would be inverted. If the historic relationship still works, that would be a strong predictor of a recession. Unless of course, this time really is different.


Leave a Reply