In Britain we seem to have a love affair with the property market. Home ownership is 69%, not especially high, but average house prices are a constant topic of discussion, mainly because property in the prosperous south east of the UK (including Cambridge) is very expensive. The latest Bank of England Financial Stability Report shows how central housing is to the UK household sector and to the banks.
Household net wealth
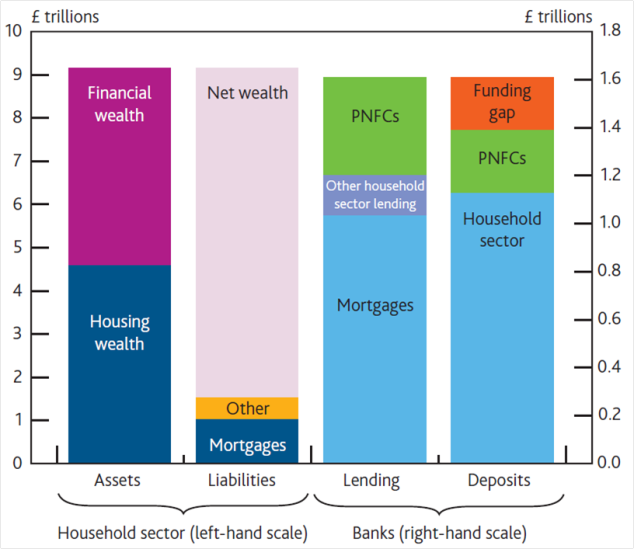
National accounts classify economic activity into the private and public sectors then sub-divide the private sector into the corporate sector and households. The household sector includes charities and unincorporated businesses, but is mostly made up of ordinary people. The chart below shows, first, the aggregate balance sheet for the household sector. About half of households assets are financial wealth, made up mainly of pension assets but including all other savings, life insurance contracts and direct ownership of shares and bonds (which is a relatively small fraction of the total these days). The other half is property.
And it shows the liabilities set against those assets – mortgage debt and other debt (personal loans, credit card debt and car loans mainly). The positive gap remaining is the net wealth (equity). Subtracting mortgage debt from the housing assets shows a large positive balance. There are many people who have substantial net equity in their home and older people have typically paid off the mortgage completely.

The banks
The diagram also shows the aggregated and simplified balance sheet of the commercial banks. Banks take in deposits, which are their main form of funding and represent a liability for the bank and an asset for the depositor. We see that most of the banks’ deposits come from the household sector (note that the scales are different). The rest come from PNFCs – private non-financial companies, or the corporate sector. There is a gap between total deposits and the banks’ total assets which represents other sources of funding such as banks’ issuance of bonds.
The banks’ lending (assets) is dominated by mortgages, making up about two thirds of the total. Corporate loans (which in practice are mainly to small and medium sized enterprises – SMEs – because large companies can tap the bond markets directly) are only about a quarter of the banks’ total lending.
So the domestic UK banking system is mainly about taking deposits in from households and lending for purchase of property by households. It means that the value of property is very important for:
i) the wealth of the household sector – so a fall in house prices is likely to have a big impact on consumption;
ii) the economic strength of the banks – a large fall in house prices would hit their balance sheets hard.
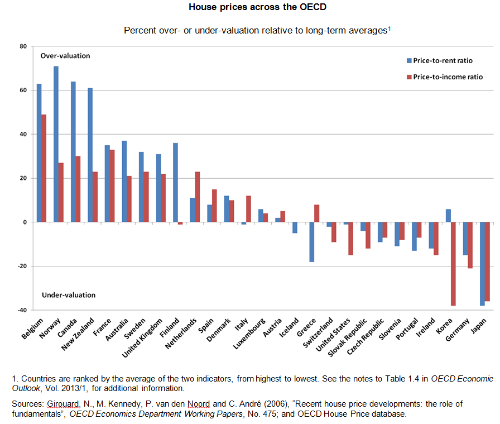
There is little reason to think that house prices will fall short term, though UK house prices fell much less after the crash than in other credit-property-boom countries (US, Ireland and top of the heap, Spain). The OECD calculates that UK prices are still overvalued relative to long term averages (though other countries are more so – see chart below). That isn’t a perfect guide, since fundamentals can change, such as the post-crash appetite of foreign billionaires and sovereign wealth funds for prime London property and increasingly UK property more generally.

But it’s a worry for the longer term. UK house prices nationally and in the south east particularly are propped up by very weak supply, mainly caused by restrictive planning rules and an over-centralised government system that robs local government of power. But since politically there are more gainers from sticking to this policy than changing it, don’t expect a large fall in property prices any time soon.
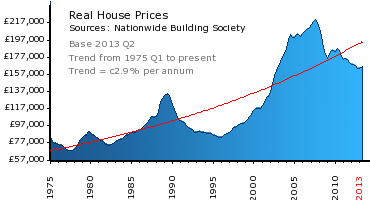
This should in no way be construed as a recommendation to buy property. All of the above conditions have been true for decades. But real house prices still fell by a third in the early 1990s. One day they will again.


Anonymous
What a great article. I’ve been looking to purchase a second property as investment and have been to-ing and fro-ing with the idea. On one hand, we are experiencing this property bubble which growing day by day with a increasing influx of foreign investors. On the other, we see a cyclical trend which you have neatly summarized in your last chart. Previous cycles appear to be decade-long except 2000 when peak continued.
Barney Rubble
Careful with assumption- currently, approximately 70-75% of business lending goes to ‘Large Businesses’ (those with a turnover of greater than £5million), while 25-30% goes to ‘Small & Medium Enterprises’ (SMEs).