When you study economics at Cambridge you are forced to get your hands dirty with some actual economic data. My colleagues and I were confined to programmable calculators and manual entry of data in those days. But the point was not so much the technical calculations as to get to grips with matters such as real and nominal data, seasonal adjustments, quarterly versus annualised data and so on. Most macroeconomic data comes in time series: a sequence of data measured at fixed regular intervals. The basic analysis of time series involves decomposing them into the underlying trend, seasonal variation and what is then left, the cycle. (There are far more complex statistical tools available to extract an underlying signal from the noise, but that’s not relevant here). Sometimes there is a “structural break” when the trend appears decisively to change. Economic cycles aren’t nicely periodic sine waves, the word “cycle” is a much looser term meaning that lots of macroeconomic variables wax and wane around a long term trend. And the word “cyclical” is used widely in investment analysis to refer to industries such as auto manufacturing and steel, the revenues and profits of which vary quite sharply across different periods of economic growth, reflecting the volatility of the economic or business cycle.
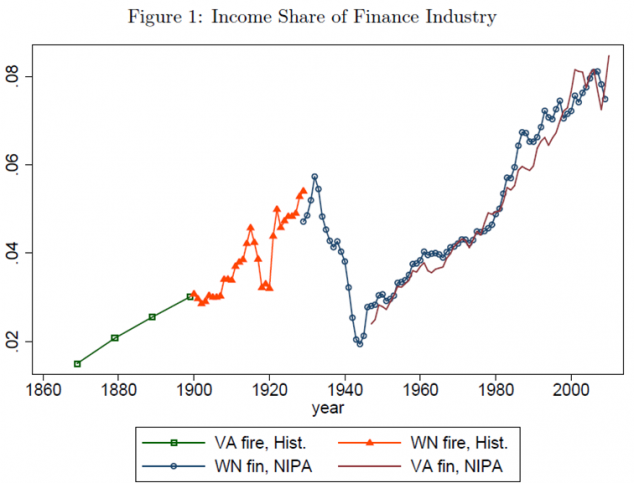
We can use this decomposition into trend and cycle to explain the dreadful condition of the investment banking industry in western countries, and London in particular. First, there has a break in the long term trend of growth in finance as a share of GDP. Here is a chart from a paper by NYU economist Thomas Philippon, showing the share of GDP made up by the finance industry in the US. The different colours represent different data sources that he has spliced together. What we see is the well know dramatic rise of finance since the second world war as a share of GDP to a peak of around 8%.
Something similar happened in the UK also, where according to Andrew Haldane of the Bank of England, the ratio of bank assets to GDP rose ten-fold from the 1880s to the mid-2000s. Another Bank of England economist, Stephen Burgess, says that financial services output grew at twice the rate of GDP during the decade before the financial crisis.
It is widely believed now that some, possibly all of this growth simply reflected cheap credit and excessive leverage in the banking industry. So the future size of the industry relative to GDP will almost certainly be much smaller. Philippon suggests it should shrink back to about 6%, which would unwind most of the growth of the last thirty years, relative to GDP.
One mechanism causing this shrinkage is tougher regulation, particularly higher capital requirements arising from Basle III, which more than doubles the minimum common equity ratio for banks to 4.5% by 2015. Some countries, such as Switzerland, have opted for tougher rules on top of this and the UK is likely to follow.
So the first thing putting investment banking under pressure is a sharp change in trend as the finance industry shrinks (relatively, if not absolutely) to a new, smaller scale in relation to the rest of the economy.
But superimposed on top of this we have a brutal cyclical adjustment arising from the slow economic recovery from the global financial crisis, made worse in Europe by the Eurozone mess. Many investment banking revenues (syndicated loans, equity and debt capital raising and M&A) are cyclical. That is, they rise and fall around the underlying trend reflecting a mix of macroeconomic conditions, credit costs, confidence and some degree of herd instinct (especially for M&A). The latest league table data from Thomson Reuters shows most of these categories were down in the first half of 2012 compared with a year before. That isn’t what you’d expect in an economic recovery, even a weak one. The most likely explanations are i) the slow economy recovery arising from deleveraging, as shown historically by Reinhart and Rogoff; and ii) a lack of business confidence in the Eurozone. And business is indeed down more in Europe than in the US or Asia. Syndicated loans (a relatively low margin product) are down by 12% in the US but by a half in Europe. Equity capital markets revenues (much higher margin) are down by 29% in the US and 53% in Europe. US announced M&A is down about 17%, EMEA by 19%. (See Thomson Reuters deal site for the data; you’ll have to register but it’s free).
It’s no surprise then, that the banks, already reeling from tighter regulation and a collapse in demand for previously profitable products like structured credit, plus the enforced exit of proprietary trading (under the Volker rule, in the US), are cutting costs still further now because of the very low deal volumes in their core investment banking activities. The job market is truly terrible in European investment banking with no prospect of recovery until there is a fundamental breakthrough in the Eurozone. At some point, the pent up demand for M&A and capital raising from European corporates will generate a surge in revenue and jobs, but that could be one or two years away, perhaps much more. Until then, banks face a nasty combination of negative trend and negative cycle, and banking jobs in London and New York will be very scarce.


Andrew Bertolina
I enjoyed this piece, especially Philippon’s chart. In my firm, we often debate the appropriate size of financial services relative to GDP, and the necessity of industry contraction. I look forward to hearing how my colleagues receive your piece.
-Andrew