

As an economist, over the years I’ve been asked two things repeatedly by people who hold economics in touchingly high regard. One is, which way will house prices move? And the other is, what will happen to the value of the pound against the dollar (or euro or yen etc.). I’ll defer the first question for another day, save to note that there is a better, though still weak, prospect of using economics to forecast property prices as they do have a limited set of fundamentals that are amenable to some kind of valuation analysis. But forecasting exchange rates is all but impossible. Let my try to explain why.
The exchange rate is a price set in a market
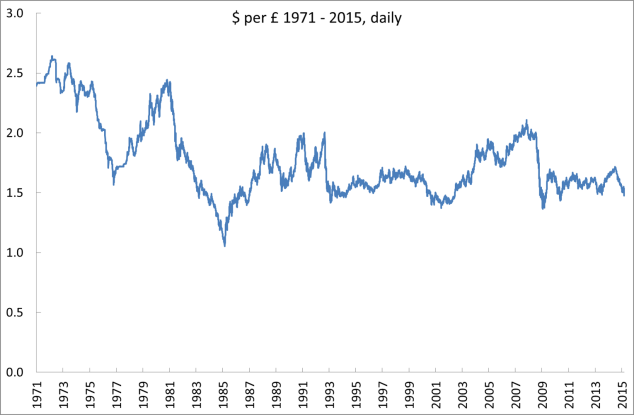
The exchange rate is a price, the price of one nation’s money relative to that of another. It’s a ratio which can be expressed either way: £1 = $1.50 or $1= £0.67. It’s largely conventional that we quote dollar/pound as what one pound will buy. This rate is known in the markets as “cable”, a reference to the days when the foreign exchange markets on either side of the Atlantic were unified through the telegraph cable, first laid across the Atlantic in 1858, which brought near-instant information in both directions. That was at least as important an innovation in telecommunications as the Internet, nearly a hundred and fifty years later. The history of cable from 1971, when fixed exchange rates ended, is shown in this chart. Aside from a general devaluation of the pound against the dollar up until the 1980s, it’s hard to see much of a pattern or trend. The recent fall in the pound, which is really a rise in the dollar, just takes the rate back to where it was a couple of years ago, around 1.5.
Ignoring government and central bank intervention to fix or influence the exchange rate, the price of foreign exchange is set in a market by demand and supply, just like any other market. So if we can forecast demand and supply, perhaps we can predict the future path of the exchange rate. Where do demand and supply come from? The accounting framework of the balance of payments gives us the place to start. The total sum of demand and supply for say dollars relative to pounds can be classified into two types of transaction, which we’ll consider from the point of view of a UK resident:
i) the current account: this captures income from sales of UK goods and services to the US (paid for in dollars) minus payments for imports from the US (which need to be paid for in dollars); it also includes interest and dividend income and payments and any other transfers such as remittances, foreign aid payments, tourist payments and receipts and travel costs.
ii) the capital account: this lists all changes in ownership of assets and liabilities between UK residents and US residents; it includes the purchase by UK pension funds of US shares (portfolio investment), the sale of a UK business to a US-based owner (direct investment), new bank loans or repayments of old loans to and from the US, and all the myriad flows of funds into and out of financial institutions between the two countries, through bank accounts and changes in securities ownership, plus real estate transactions.
If we added up all of these we would find that they sum to zero. Why? Because the total demand must meet supply, in the absence of government intervention, as there is nowhere else for the transactions to go. If there is a rise in demand for pounds versus supply then the imbalance will push up the price, the exchange rate of pounds relative to dollars. One pound will buy more dollars in this case. The exchange rate is a price, which continuously adjusts (it is traded somewhere in the world 24 hours a day) to balance demand and supply.
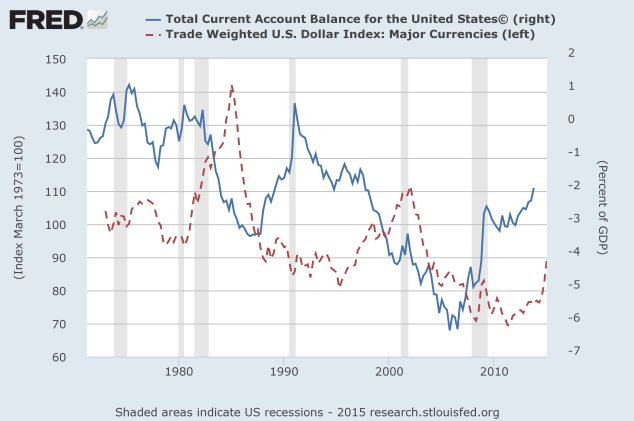
So if we could analyse all of these types of flows we might have a shot at forecasting the future. In the days before the capital account became so important, there might have been some value in forecasting the current account. If the UK were running a current account deficit, perhaps because the growth of demand in the UK exceeded the sustainable growth of UK supply, causing that demand to “leak” abroad in rising imports, then that would be a signal that the pound might tend to fall. And early economic theories of the exchange rate did predict that. A balance of payments deficit cannot continue indefinitely if it means the country is building up a level of foreign debt that will eventually be unpayable. But there is no clear time scale during which we can identify when “too much” happens. The US has run a current account deficit for many decades but that has been largely irrelevant to the annual ups and downs of the dollar. The chart below shows the overall average exchange rate of the dollar (weighted by trade) compared with the US balance of payments on current account (mostly in deficit). There is a very broad relationship between them (in fact the correlation coefficient is 0.28). But the current account has not been a reliable guide to the future path of the dollar. Note that the pronounced peak in 1985 was such a concern that it led to the “Plaza accord” between the rich nations, signed in the Plaza hotel, under which they all pledged to intervene and state publicly that the dollar was too high. This was the last time in history that the rich countries successfully intervened in the world financial system. Any attempt today would almost certainly fail, overwhelmed by the vast scale of foreign exchange markets.
Exchange rates are dominated by financial flows not by trade
And what makes the exchange rate so hard to forecast now is that the inflows and outflows of the capital account part of the balance of payments vastly dominate the current account. The latest Bank of England semi-annual survey of the London foreign exchange market put the daily turnover at October 2014 at $2,667 billion, 11% higher than the year before. London is the world’s largest foreign exchange market, not because the UK is the largest economy, which it obviously isn’t. London is a convenient and efficient centre for these trades, even though the dollar is far more important than the pound. The dollar accounted for 88.2% of trades, up slightly from 87.4% in April 2014, a surprise if you’re one of the many people expecting the dollar’s international role to decline. The Chinese yuan declined from 1.4% to 1.3%, just behind the Mexican peso. The pound was fourth behind the euro and yen. (Note that since all exchange trades involve two currencies the total market share is not 100% but 200%).
The World Trade Organisation annual report for 2014 estimates total global merchandise trade in 2013 as $18,301 billion and services trade as $4,644 billion for a total of $22,945 billion. Dividing this by 365 days we get $63 billion, compared with total London foreign exchange daily trading of $2,667 billion. Even allowing for the volumes of foreign exchange transacted in remittances (very important in many developing countries) and tourism and travel, we would struggle to explain even 10% of total foreign exchange volumes from current account transactions.
So what dominates the exchange rate of the major global currencies is the capital account. We might make a stab here at forecasting both portfolio flows and foreign direct investing. Each has a long term or structural component. We know that countries tend over time to want to add foreign assets to their portfolios, because it brings diversification benefits. We might hazard a guess that there is a long term flow of corporate investment to countries with good growth prospects such as China and India, assuming those countries allow such investment in.
But we would still account for only a small part of daily flows because they are dominated by short term flows of banks, hedge funds and other financial institutions which are actively trading and hedging on a collectively vast scale. They look for both yield (interest payments) and capital gains, adjusted for risk. They can use spot and derivative trades to express their views. They can transact very quickly at very low transaction costs. And they have access to more information than any retail investor ever will.
The forex market looks pretty efficient
If you have a lot of professional traders who are astute, highly motivated to make money and avoid losses and who have access to a great deal of data and computing power, you will have what economists call an efficient market. Theory and practice tells us that such markets are likely to be characterised by a very rapid incorporation of new information into prices. So if there is a surprise increase in interest rates in the US it will have a nearly instantaneous effect on the exchange rate, very likely driving up the value of the dollar. (One could construct a scenario in which, owing to a crisis of confidence in the US, a rise in interest rates led to a panic that lowered the dollar’s value but that’s unlikely).
In a market like this, the exchange rate reflects the aggregate expectation of market participants’ views of the future of all relevant variable. So any news must be unexpected to have any impact. If it is news that was already expected then it’s not really news and should have no effect on prices. True news is as likely to be positive for the exchange rate as negative. If that were not the case then there would be a systematic bias in the movement of the exchange rate which those astute traders would notice and would therefore buy or sell accordingly, until the bias was removed. The logical consequence of this is that the exchange rate wil move randomly up or down according to actual news as it arrives. This random walk feature is a characteristic of all efficient asset markets.
The conventional wisdom in academic circles has been that foreign exchange markets are efficient (in their limited sense of the word) and that exchange rates move randomly. A classic paper in 1983 by Meese and Rogoff argued that no macro model was able to meet random walks in forecasting exchange rates, on the basis of data from the 1970s. Later authors tried supposedly better models, including monetary models which were somewhat fashionable during the high period of monetarism but which failed to prove any better than the earlier current account models.
If the consensus is correct, it would imply that the best guide to the future exchange rate is the current one. So if you want to buy dollars for your July foreign trip you might as well buy them now as then you have certainty. If you wait till July you are theoretically equally likely to get a better and a worse rate. Since most people dislike risk then in the absence of any offsetting expected return, the logical strategy is to buy once you know that you will definitely need the currency. (Some people are temperamentally more likely to regret things they did rather than things they didn’t do, in which case the opposite advice would apply).
Perhaps PPP helps?
But a recent piece of research tries to overturn the conventional wisdom on random walk exchange rates. It takes us back to a very long established view, one that rather vanished after the liberalisation of capital flows worldwide in the 1970s and 1980s. The view is that currencies tend to converge on a purchasing power parity (PPP) equilibrium. The purchasing power of a currency is the combination of the underlying real exchange rate and the average level of prices in the economy. Changes in the average level of prices are what we call inflation. So if two currencies started at equilibrium and their relative inflation rates diverged then we’d expect the exchange rate, the actual (nominal) rate in the markets, to adjust to offset that relative difference in inflation so as to leave the underlying real exchange rate unchanged.
Now we don’t know for sure what the true or equilibrium real exchange rate is at any point, as that depends on the macroeconomic model used. For example economists argue whether the current dollar/yuan exchange rate is about right or the yuan is still 10-15% undervalued. But the PPP theory suggestst that changes in exchange rates in future should be closely related to differential inflation. Three economists, one from the European Central Bank and two from the Bank of Poland, provide evidence not just that is true but that it beats the random walk theory when tested on data from the dollar and euro from 1975 to 2012 (the euro being synthetically constructed till 1999).
Unfortunately for the people wondering about their holiday currency, the authors find that the PPP model dominates for several currencies tested in the long run, which here means three to five years. In the short run the random walk model still works pretty well. So if you’re going on holiday to the US in 2018 then perhaps the model has something to tell you, though the very low absolute levels of inflation at present provide little by way of a guide to the future change in exchange rates. Otherwise you’re back to using the current rate as your best guide.
Abdulai Nyei
Very interesting read!
Ciaran McCloskey
An interesting article to read, but I would have to respectfully disagree with you. I position trade the major currencies including gbpusd and having collected large amounts of data with a minimum 1 month look back period. I designed a strategy which, instead of trying to optimise the historical data, literally tests “does trend following as a whole work?” which essentially meant testing very generalised strategies with only 1 parameter. I have statistically significant data over a 25 year period (sample size approx 500) with returns of around 15% p.a. With C.I. +/- 3% for 95% of population after transaction costs. Max drawdown over that period was 68% which only occurred once, average drawdown of 25% over the 25 year period. I started trading this strategy just over a year ago now which real money and I’ll admit I was lucky last year as you know there was major trends in the US dollar but I’ve made 108% profit (doubled my money) in the first year. Now, of course I don’t expect that kind of return to continue but certainly I don’t believe this kind of return follows a model for random walks. One challenge to my strategy might be “how would you have known to pick those currencies in hindsight ” the answer is of course I would not know however 25 years ago the dollar was still the major currency of the world as where many of the others. I don’t believe this will remain the same forever however changes like this occur over decades and do not happen over night.
I’ll make sure to let you know in 24 years time how I’ve got on 😉
estate agents peterborough
One reason why I agree in the fact that exchanges rates are almost impossible to forecast is that exchange can fluctuate massively with the strength of each country’s economy. Looking at the fiasco that ensured with Iceland and their banking system along with the financial state Greece are in, both of those countries states were not immediately apparent to all other nations. As a direct result their exchange rate against other currencies will have remained strong until all this information came out publicly.