

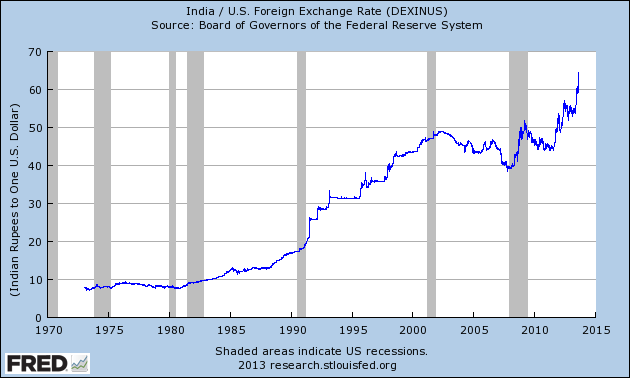
The fall in the Indian rupee in the last few weeks is a result of three things: i) a current account deficit that made the country vulnerable to a sudden exit of funds; ii) the inherent volatility and instability of international capital flows; and iii) the global change in attitudes to risk, especially in emerging markets, arising from expectations of higher interest rates in the US. This chart shows the rate of rupee to the dollar, so a rising number means a falling value of the rupee.
You can think of the first two as background factors, setting the scene. It then needed only a trigger, in the form of the Federal Reserve’s much anticipated “tapering” of its large scale asset purchasing (“quantitative easing”), which is widely expected to begin this autumn. That trigger might not have happened at all, or it might have been delayed by many months. But the lessons of financial history is that a country with the vulnerable economic conditions that India faces will sooner or later experience an outflow of funds and that can quickly become a self-reinforcing panic.
Background factor (i) The current account deficit
The latest annual IMF Article IV report on India, which was published in February 2013, is quite clear. India faces “rising external vulnerability” (section D). What does this mean? The balance of payments current account deficit is the gap between the financial resources used by a country and those that it generates. A deficit means the country is importing savings from the rest of the world to fill a gap in its own savings, relative to investment. It is quite normal for a growing developing economy like India to have a deficit. But a problem arises if it is either too large or funded in an unsustainable way.
The India current account deficit reached a record high of 4.2% of GDP in 2012, driven by a fall in exports with little compensating fall in imports. India’s disappointing export performance is partly owing to its weak supply side, following years of underinvestment in infrastructure, especially energy and transport. The IMF estimates that a current account deficit of 3-3.5% is safe for India, so long as it’s achieving its growth potential. At that level, the increase in net foreign debt arising from the deficit would grow less quickly than the country’s ability to service that debt so the debt ratio would be stable or falling. But over 4% is a problem.
Background factor (ii) volatile capital flows
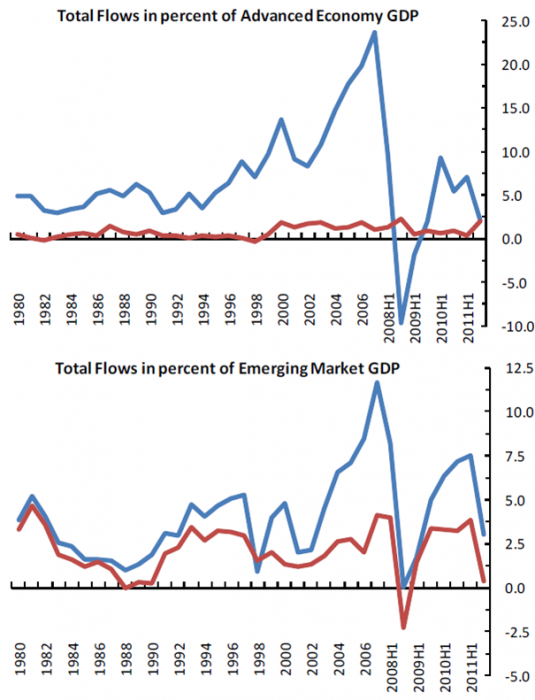
It is pretty clear to anybody who looks at financial history that international financial flows are volatile, unreliable and herd like. International investors tend to rush into and out of countries at the same time. A recent IMF working paper confirms that “private capital flows are typically volatile for all countries, advanced or emerging, across all points in time.” This chart from the paper shows that while gross flows are similarly volatile for advanced and emerging economies, net flows (that is, taking into account flows in the other direction) are much more volatile, relative to GDP, for emerging economies.
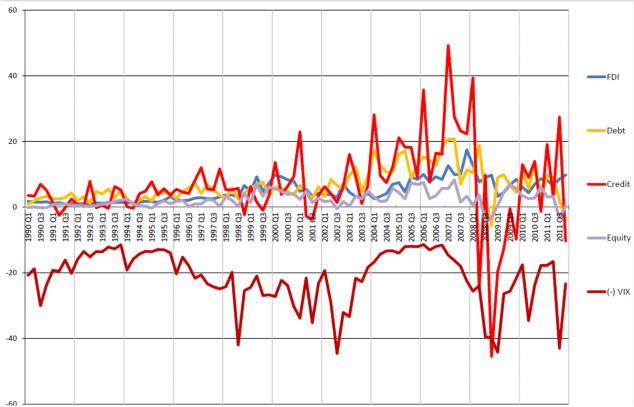
Other recent research shows that these flows are not random. They are globally linked, and tied to US interest rate policy. A report presented at this year’s Federal Reserve economic policy symposium at Jackson Hole earlier this month by the award winning LBS economist Hélène Rey, showed that global financial flows, whether equity, credit or FDI, tend to be driven in part by rises and falls in risk tolerance, as measured by the VIX index of volatility, which partly mirrors the Fed’s monetary policy (see chart below, flows shown as a percentage of GDP). (The VIX is a measure of implied volatility for options on the S&P 500 index traded on the Chicago Board Options Exchange, and is widely used as a general measure of financial markets “fear”.)
One way of mitigating the risk of destabilising inflows and outflows (even inflows can cause problems for a country if they are sudden and large, but outflows are worse) is to finance current account deficits through long term rather than short term finance. The best type of financing is FDI – foreign direct investment. This refers to investment, mainly by companies, in large or majority stakes in existing or new companies. A US company which buys an Indian company or a major share of it, is FDI, as is a Germany company that brings money in to fund a new factory. This investment is, by its nature, long term and not easily reversed. FDI is very easy to do in some countries, which therefore attract a lot of it. India is not one of these; regulatory and other barriers make it still quite difficult for foreign companies to invest in the Indian corporate sector.
Before the global financial crisis, FDI more than covered the current account deficit, meaning that India was facing a net inflow of funds. But that has reversed in recent years and FDI now only funds about half the deficit. The remainder is funded by mainly short term flows, which by definition can be reversed within a year. Some of the flows are deposits in India by non-resident Indians (NRIs) whose confidence in the economy can be fickle. The upshot is that India had become dangerously vulnerable to a change in sentiment by these providers of short term foreign funding.
The trigger (iii) the rise in US interest rate expectations
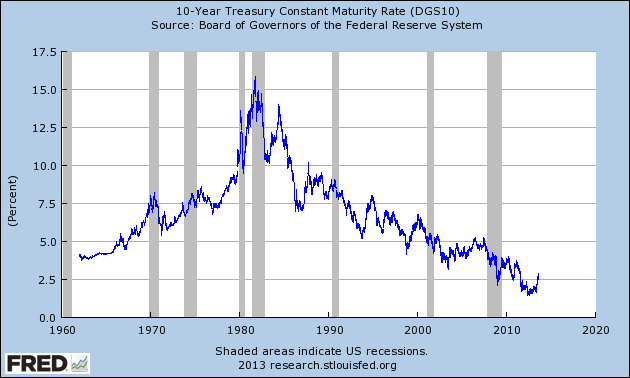
The recent increase in US interest rate expectation caused an ebbing of the former flow of funds into emerging markets, which are now judged by many investors as too risky, compared with before. This behaviour is somewhat rational, to the extent that the rise in long term US interest rates is an increase in the global risk free rate. The chart below shows the recent rise in US 10 year Treasury yields, which is proportionately quite large compared with previous short term low, but in absolute terms remains low compared with the last 50 years.
But the effect of rationally based financial flows tends to be magnified by the herd like behaviour of investors. This global change of sentiment affects all economies in some degree, because it is a re-pricing of risk. But it is a problem for those countries with vulnerable economic fundamentals or which rely disproportionately on short term foreign funds. India is top of the list though it is not alone. The Turkish lira and Indonesian rupiah have also suffered in the last couple of months.
It’s a bit different this time
The previous, and so far, much worse Asian financial crisis in 1997 was partly a result of countries maintaining fixed exchange rates. This time around India has a floating exchange rate, government debt is not that high and the country holds much higher levels of foreign exchange reserves. It is therefore unlikely that we are looking at a repeat of the 1997 crisis, though there are some difficult times ahead for several countries.
The difference between fixed and floating rates is that with floating rates the price of domestic currency relative to foreign currency (e.g. the dollar) is set by demand and supply. A fall in foreign demand for the rupee, all else equal, drives down its price. In a fixed exchange rate regime, the government attempts to keep the rate constant and can only do this by a combination of restricting demand and supply and by filling any gap between them by central bank purchases.
The advanced economies tend to have entirely floating rates – their central banks don’t intervene at all in the foreign exchange rate market. India has a more managed rate. The government maintains some controls (recently tightened) on the ability of domestic residents and foreigners to exchange foreign and rupee currency. It also uses its reserves to intervene and has tried to slow down the fall of the rupee, at the expense of using some of its foreign exchange assets up. But the rupee will inevitably fall until the market has had enough or is convinced that something will change.
The rupee crisis is ultimately a result of the well known failure over many years of Indian policy makers to restructure the economy and improve its long term growth rate. Short term macroeconomic fixes may help stabilise the rupee but what is really needed is widespread economic reform. The last time India suffered a balance of payments crisis, in 1991, some important reforms followed. If something similar happens this time then the rupee fall will not have been in vain.
Abhinav
Great article!
Based on the last chart, is there reason to believe that there little or no correlation between periods of recession and bond yields?
Also, at the moment there’s only expectation of rise in interest rate. Is there anything which might cause a reversal of the expectation and its effects? Thanks.
Simon Taylor
Thank you. The level of bond yields has been declining since the late 1970s because inflation expectations declined, after the peak of high actual inflation in the 1970s. The absolute yield doesn’t tell you much about recessions. But the relationship between short term and long term yields can do. This is called the yield curve. A high short term rate relative to long term typically means the central bank has raised rates to prevent inflation, which will slow down the economy and possibly cause a recession. This is called an inverted yield curve (because the normal pattern is for long yields to be higher than short, reflecting the higher risk of holding longer term assets – the term premium, which I covered in an earlier post).
Current expectations of higher short term rates are quite muted, but reflect the expected “normalisation” of policy after an exceptional period of short rates to combat the recession following the financial crisis. Evidence that the recovery had stalled or reversed would reverse these expectations of higher rates. But the general pattern of US macro data is consistent with a gentle recovery and so normalisation of rates.