In economics and finance it is important to be clear about when we’re discussing a stock – the amount of something at a point in time – and when we’re referring to a flow – the volume of something during a period of time. So the US has a particular level of debt at a moment in time, which is a stock. And it has an annual deficit that represents, during a year, the addition to that debt.
It’s like considering the amount of water in a pond (the stock) versus the flow of water from a river running into the lake (the flow, measured over a period of time). Ignoring evaporation and leakage, the flow must eventually increase the stock, so stocks and flows are logically linked. But a problem arising from a stock of debt isn’t necessarily a problem for the flow of interest payments, at least for the US.
The US leveraged global equity play
The US is the world’s largest net international debtor. The word “net” refers to the offsetting against the gross debt of the assets held overseas by US residents. It’s not that the same people hold the debt and the assets but taken as a whole the economy has less of a problem with the debt if it holds equivalent assets. For a company, assets can to some extent be sold to pay off debt. This is less easy for a country because the owners are different. Much of the US debt is attributable to the federal government and federal agencies such as Fannie Mae and Freddie Mac (formerly in the private sector but now de facto owned by the government). The assets mainly consist of private sector ownership of stakes in companies and institutional holdings of stocks and bonds abroad.
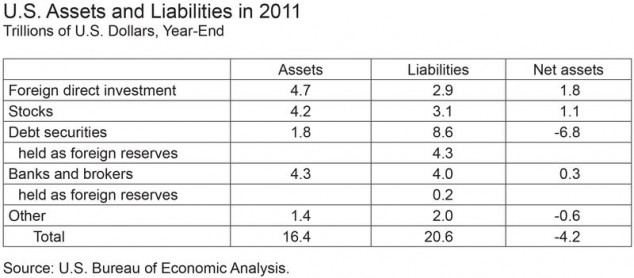
What matters for the sustainability of the net debt is the flow of income to the assets and the flow of expense arising from interest payments on the debt. Here the US is in luck, because the income still exceeds the cost. A recent article by the New York Federal Reserve Bank of New York shows the data. Here is the statement of the US’s international assets and liabilities.
The table shows that net assets for the US at the end of 2011 were a negative $4.2 trillion. But the nature of the assets and liabilities is different. The US has a big surplus ($1.8 trillion) in its foreign direct investment (FDI), which represents companies investing abroad versus foreign companies with subsidiaries in the US. It also has a surplus ($1.1 trillion) on holdings of stocks (equities). It has a huge deficit ($6.8 trillion) on debt securities.
The FDI and stock holdings are equity investments. These are “financed” by large holdings of debt. Most of the time equity returns are higher than debt interest, because equity carries more risk. The actual income received is in the form of dividends. The dividend yield is not necessarily higher than the interest costs, but there is usually a capital gain too, which raises the total equity return above the cost of debt.
And so it is for the US net investment income. The US receives a higher return on its foreign assets than it pays, in aggregate, on its foreign liabilities. So the balance of payments annual flows arising from the net debt stock are still positive overall. You can think of the US as running a huge leveraged equity position, financed by cheap debt from willing creditors in Japan, Germany and China. Leverage is not always a good thing but if you believe that global equities are a good long term investment then this “portfolio” is not a bad one.
Of course if the US keeps borrowing abroad then eventually the net income flows will go negative too, hitting the US balance of payments further. Or a global rise in interest rates could worsen the gap.
Annual losses to the People’s Bank of China
The flipside of the cheap lending to the US is that somebody elsewhere is receiving a low income. A different research article, this one from the Federal Reserve Bank of San Francisco, shows that the cost of the large Chinese foreign exchange reserves, much of which are invested in US government debt, is an annual loss to the People’s Bank of China, the Chinese central bank.
The PBOC obliges Chinese exporters to sell their dollar export earnings to the central bank. These are purchased at the current exchange rate (about RMB6 to the dollar at present). So the PBOC acquires US dollar assets in exchange for printing new RMB money. As it doesn’t want the Chinese money supply to rise and risk causing inflation, it “sterilises” the money created by selling an equivalent amount of bills (short term bonds) in the market, thus mopping up the surplus liquidity. It therefore exchanges the liability of money (on which it pays no interest) with the liability of bills (on which it does pay interest).
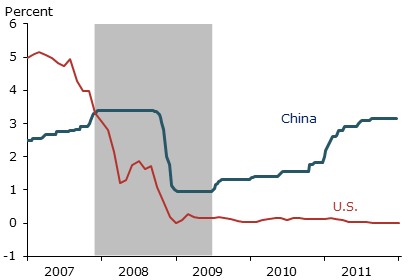
The dollars are invested, to a large extent, in short term US government bills (which remain the world’s closest thing to a risk free asset). So the PBOC has US interest paying bills as an asset, balanced by RMB interest paying bills as a liability. Unfortunately for the PBOC, the interest it pays on domestic bills is about three percentage points higher than what it receives on the US government bills. The gap used to be the other way but with the fall in US interest rates since the financial crisis, this has become a very loss making trade for the PBOC (see chart below).

If you apply 3% interest differential to the entire $3.2 trillion of Chinese foreign exchange reserves you get an annual cost of $96 billion. This is something of an over-statement, because some of the reserves may be invested in higher return longer term bonds or in other financial assets such as equities. But the rough order of magnitude is right. And of course this trade carries a major exchange rate risk. Any decline in the dollar against the RMB will cause capital losses for the PBOC. And all the time, the PBOC, and the central banks of many other Asian surplus economies, are financing the US overseas equity portfolio.


Leave a Reply