

It might seem straightforward to measure how much debt a government has. But it’s not that simple. First, we have to decide what is “debt”. We should obviously include debt securities and bank loans. But what about pension and insurance guarantees?
Second, we must decide what is “the government”. We might decide to include only central government. But what about local government? And then there are public corporations. We might add the central bank and other government owned financial corporations, where they exist.
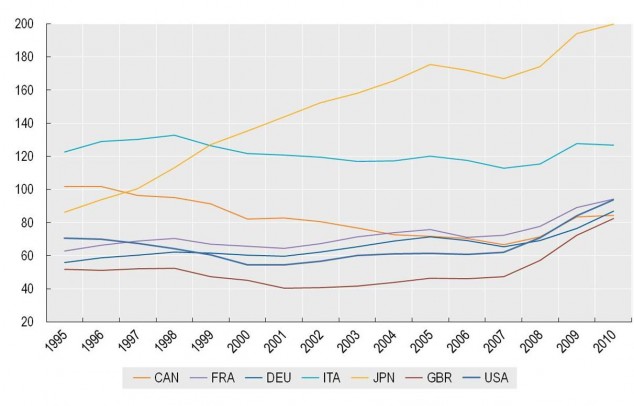
For some countries, varying the definition doesn’t make much difference. Poor old Italy for example has a lot of debt, whichever way you look at it. According to an IMF paper on this subject, nicely titled “What Lies Beneath”, Italy’s debt to GDP ratio varies from 102% on a narrow definition of both debt and government, to 127% on the broader interpretation of both. The figure usually used when discussing Italian public debt is the higher one. The OECD Factbook 2011-12 shows Italian general government debt at 127% for 2010. So the IMF exploration of different definitions doesn’t yield any surprises here.
But for Canada it’s a different story. (I’m not picking on Canada just because the next governor of the Bank of England is a Canadian, it’s just the best example from the IMF report). The OECD figure for Canada’s general government debt to GDP is 84% in 2010. This is high, if not yet worryingly so. There is a rough rule of thumb that countries with debt to GDP of more than 90% experience slower growth, though that doesn’t mechanically apply and is less important for countries that can borrow in their own currency, which includes many rich countries including Canada.
If we apply the widest debt/government definitions, the figure for Canada jumps to 104%, not quite Italian in scale but quite a lot worse than 84%. If this looks too alarming, we can use the narrowest definition, which brings Canada’s debt down to only 38%. The range of figures for Canada is shown in this graphic from the IMF report. The grid shows different definitions of the scope of government on the vertical scale and different definitions of what is debt on the horizontal.
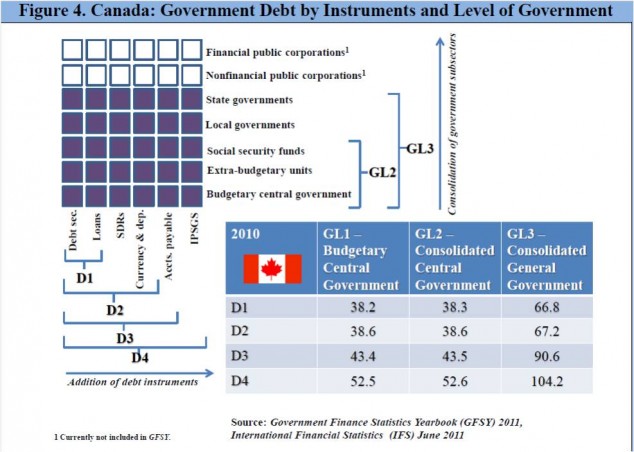
Germany’s highest figure is 87%, Japan’s is 212% and that of the USA is 94%, which are all consistent with the usual quoted figures. The OECD conventional definition of debt is shown below.
DS
Above difference for Canada is probably because GL3/D1 adds the debt of the provinces. Ontario and Quebec will probably eventually be an issue. In the ST (at least until Jun 1 when he leaves Canada), Mark Carney is probably more concerned about the ratio of household debt to income which is currently at 165%.
“Canada’s provinces are in long-term fiscal trouble.
That was the conclusion of a recent report from federal Parliamentary Budget Officer Kevin Page, who noted that — while Canada’s federal government is on relatively stable footing — the provinces are on an unsustainable long-term path.
If current trends continue, Page’s report stated, within 70 years the provinces will have accumulated debt equivalent to 350 per cent of Canada’s GDP — a stunningly high debt level that no country could support.”
http://www.huffingtonpost.ca/2012/10/16/provincial-debt-deficits-_n_1970344.html#slide=1637475